Library TOUR MAPS
I made all the maps using the traveling salesperson (TSP)* model. The TSP model works by requiring you to visit a certain set of points (in this case each CLP location), in the shortest (total) distance possible.
Here are the steps I used to build it:
1) Downloaded library location data from Western Pennsylvania Regional Data Center (WPRDC).
2) Opened the CSV file in Excel.
3) Created a TSP model in Excel that included all 19 CLP locations.
4) Ran the model, telling the computer to “visit” each location exactly once, and to minimize the total distance traveled.
5) Resulted in: a list of library locations in order of the best way to visit them. You can start your journey at any location, and then continue through the list until you back to the starting point. You can see what that looks like graphically in Figure 3.
6) Plugged the list into Google Maps driving directions to get a more realistic picture of the route. The first map is the route for cars (Figure 1). T second map is the route for pedestrians (Figure 2).
Testing the Model:
My friend Justin tested out my model on his bike and I wrote about it for Carnegie Library of Pittsburgh's (CLP) Eleventh Stack blog.
*To learn more about the TSP model and other ways to implement it, check out this piece from Randal Olson.
Figure 1 - Driving tour.
Figure 2 - Walking tour.
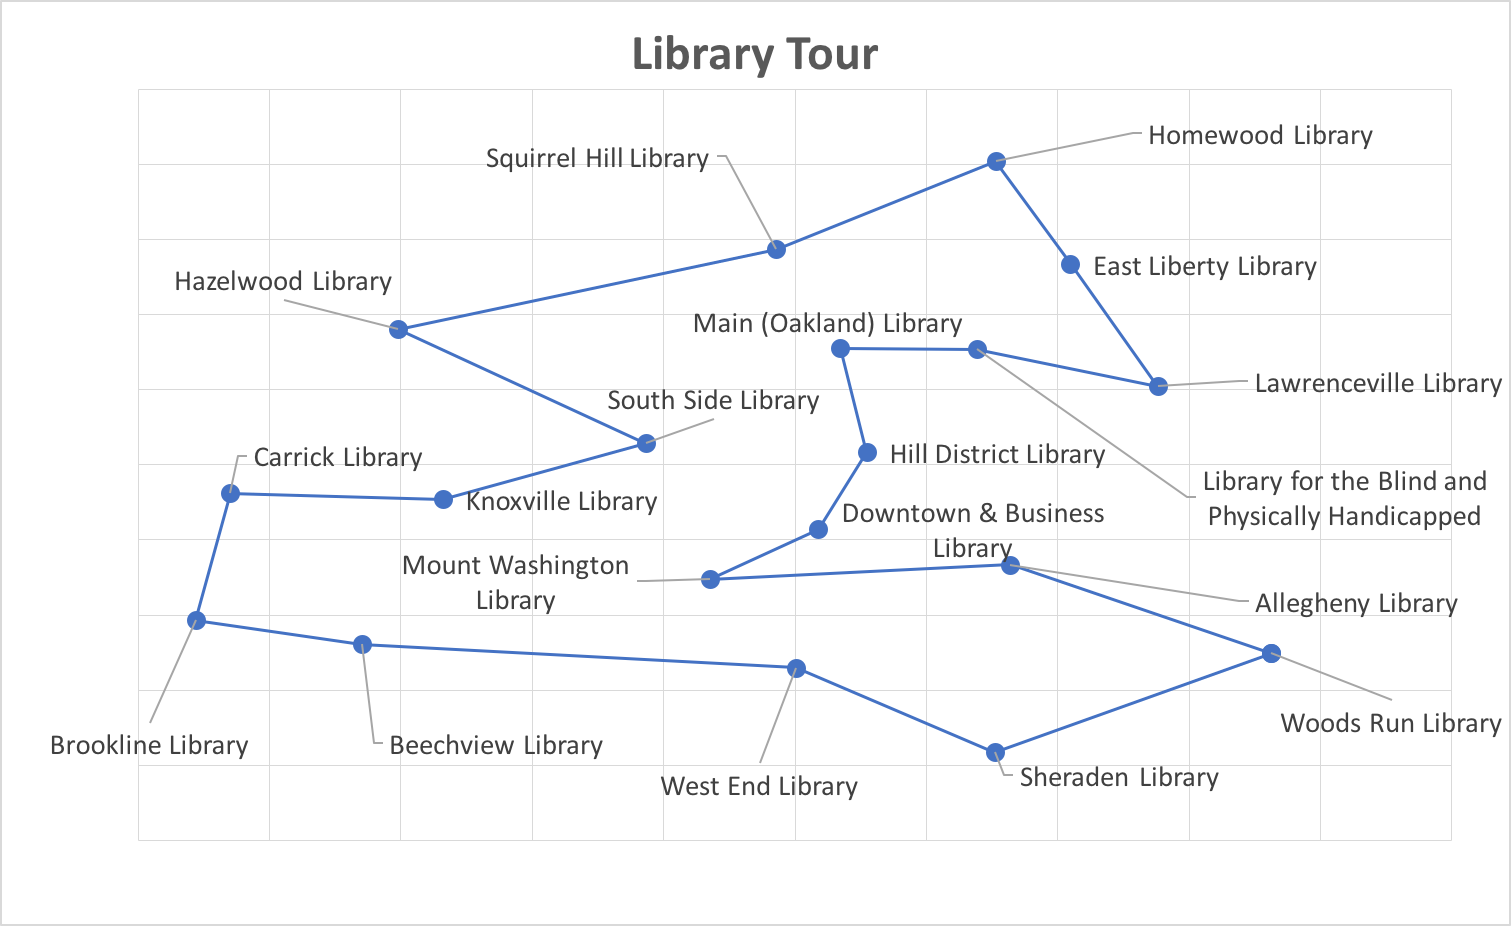
Figure 3 - Library TSP graphical model.